 Vin
Auto Auction Car Prices: A Bidder's Guide to Real Value
By VinCheck Editorial Team, Editorial Standards & Review · Published 2026-09-29 · Updated 2026-09-29 · Reviewed by VinCheck Editorial Standards
Wholesale auto auction prices in the U.S. are best tracked through the Manheim Used Vehicle Value Index, which stood at 208.18 in August 2026, down 0.85% month over month. That move shows why a bidder should treat the headline index as market context, not as the final value of a specific vehicle.
The more useful question is what remains after the hammer falls. Auction fees, transport, title status, mileage, reconditioning, powertrain demand, and local retail conditions can turn an apparently attractive bid into an expensive mistake. The wholesale market is also moving unevenly. Retail asking prices can remain firm while auction values soften, and electric vehicles can follow a different path from gas-powered inventory.
The practical advantage goes to the bidder who prices the entire transaction, not just the auction lane.
Table of Contents
- What Auto Auction Car Prices Actually Measure
- The Core Price Drivers Every Auction Lot Shares
- How Auction Prices Connect to Retail Asking Prices
- Researching Historical Auction and Salvage Records
- Bidding Strategies for Salvage, Trade-In, and Dealer Auctions
- A Practical Workflow for Bid Day
- Where Auction Prices Are Heading and What It Means for You
What Auto Auction Car Prices Actually Measure
Auto auction car prices describe a wholesale transaction. In its simplest form, the wholesale auction price is the hammer price a dealer pays for a vehicle through a physical or online auction, before fees, transportation, repairs, and reconditioning. The seller may be a dealer, fleet operator, lender, leasing company, insurer, or other commercial owner.
For U.S. wholesale pricing, the most useful broad benchmark is the Manheim Used Vehicle Value Index, or MUVVI. The index is based on completed sales at Manheim's U.S. auctions across 20 market classes, making it a market-level indicator rather than a quote for an individual lot. In August 2026, it reached 208.18, fell 0.85% month over month, and rose only 0.4% year over year, the weakest annual growth pace since December 2025, according to the latest used-car price data.
That reading tells you the direction and temperature of wholesale demand. It doesn't tell you whether a particular Toyota Camry, Ford F-150, or damaged crossover deserves your next bid.
An index is not a vehicle appraisal
An index blends thousands of transactions. A single lot has its own pricing identity, shaped by:
- Mileage and odometer thresholds, especially when a vehicle crosses a psychologically important round number.
- Trim and equipment, including drivetrain, safety features, towing equipment, and option packages.
- Condition and disclosure quality, from clean mechanical performance to frame, flood, or title concerns.
- Color and regional demand, which can matter more for enthusiast, luxury, truck, and convertible inventory.
- Auction channel and buyer pool, since a dealer-only lane, salvage marketplace, and open online sale attract different bidders.
Manheim's historical benchmark also shows how quickly wholesale pricing can normalize. The MUVVI ended December 2025 at 205.5, up 0.4% versus December 2024 and only 0.1% month over month, below its long-term average annual increase of 2.3%. Manheim reported that wholesale prices in the first half of December 2025 were up 0.7% year over year, while non-adjusted prices fell 0.2% from November, as described in its Used Vehicle Value Index.
Practical rule: Use the index to decide whether your baseline should move. Use comparable vehicles to decide what your lot is worth.
The distinction matters because wholesale prices can react rapidly to financing conditions, supply shocks, and demand changes, while a vehicle's final value still depends on its own condition and selling environment.
The Core Price Drivers Every Auction Lot Shares
Every lot carries a different story, but the same pricing forces keep appearing. Supply determines how much inventory reaches the lane. Rental returns, off-lease vehicles, repossessions, trade-ins, and insurance losses can all change the mix available to buyers. When many similar vehicles arrive together, sellers compete for attention and bidders gain alternatives. When supply tightens, buyers may chase fewer units.
Demand works at the other end of the transaction. Dealers assess which vehicles can move through their lots, how much local shoppers will pay, and how much capital an aging unit will consume. A popular configuration can attract strong bidding even when the wider index is flat. A less desirable vehicle can lag the market despite a clean history.
Mileage creates pricing steps
Mileage doesn't always behave like a smooth discount. Research into wholesale and retail car markets found that vehicles just above a 10,000-mile cutoff sold for about $150 to $200 less than otherwise similar vehicles just below that threshold, while wholesale depreciation ran at roughly half the rate of retail depreciation, according to this research on wholesale vehicle markets.
That finding changes how a bidder should read the odometer. A vehicle at 60,100 miles may face a different buyer reaction from one at 59,900 miles, even when the mechanical difference is negligible. The auction market often prices the label attached to a mileage band, not only the miles themselves.
Condition grade then compounds the adjustment. A clean, well-equipped vehicle with transparent disclosures can outperform an apparently similar lot with warning lights, missing keys, poor photos, or uncertain title documentation.
Configuration and seasonality narrow the comparison set
SUVs, trucks, sedans, hybrids, and EVs don't share one demand curve. Manheim data cited by Carbly found that its mix-, mileage-, and seasonally adjusted index rose 2.1% year over year to 124.3 in August, while the largest seasonal decline usually occurs from September through November, when adjusted prices average an additional percentage point of depreciation per month. That auction market context from Carbly supports a simple conclusion: a bidder should compare the lot with vehicles that share its body style, powertrain, mileage, region, and selling window.
The table below is intentionally qualitative. The exact dollar adjustment belongs in your local comp set, not in a universal formula.
| Driver | Typical impact on hammer price |
|---|---|
| Supply volume | More comparable inventory usually weakens bidding leverage for sellers |
| Local demand | Strong retail demand can lift clean, fast-moving configurations |
| Mileage band | Round-number thresholds can create discrete discounts |
| Condition grade | Mechanical, cosmetic, and disclosure problems reduce buyer competition |
| Configuration | Trucks, SUVs, EVs, and sedans can move independently |
| Seasonality | Fall pressure can increase depreciation risk as inventory ages |
| Title status | Branded or salvage titles generally require a separate resale and repair model |
A 2021 midsize sedan at 72,000 miles in grade 3 may sell below a 45,000-mile grade 2 vehicle of the same trim, but the exact gap depends on the auction, region, disclosure, and buyer pool. The useful lesson isn't a fixed haircut. It's that discount tiers stack, and bidders should identify each one before entering the lane.
How Auction Prices Connect to Retail Asking Prices
A 0.6% decline in the Manheim Used Vehicle Value Index during the first half of July 2026 did not produce an equivalent drop in retail asking prices. Wholesale values were cooling, while retail listings stayed near record levels, with average asking prices reported around $27,027 to $30,200, according to this July 2026 wholesale and retail market report.
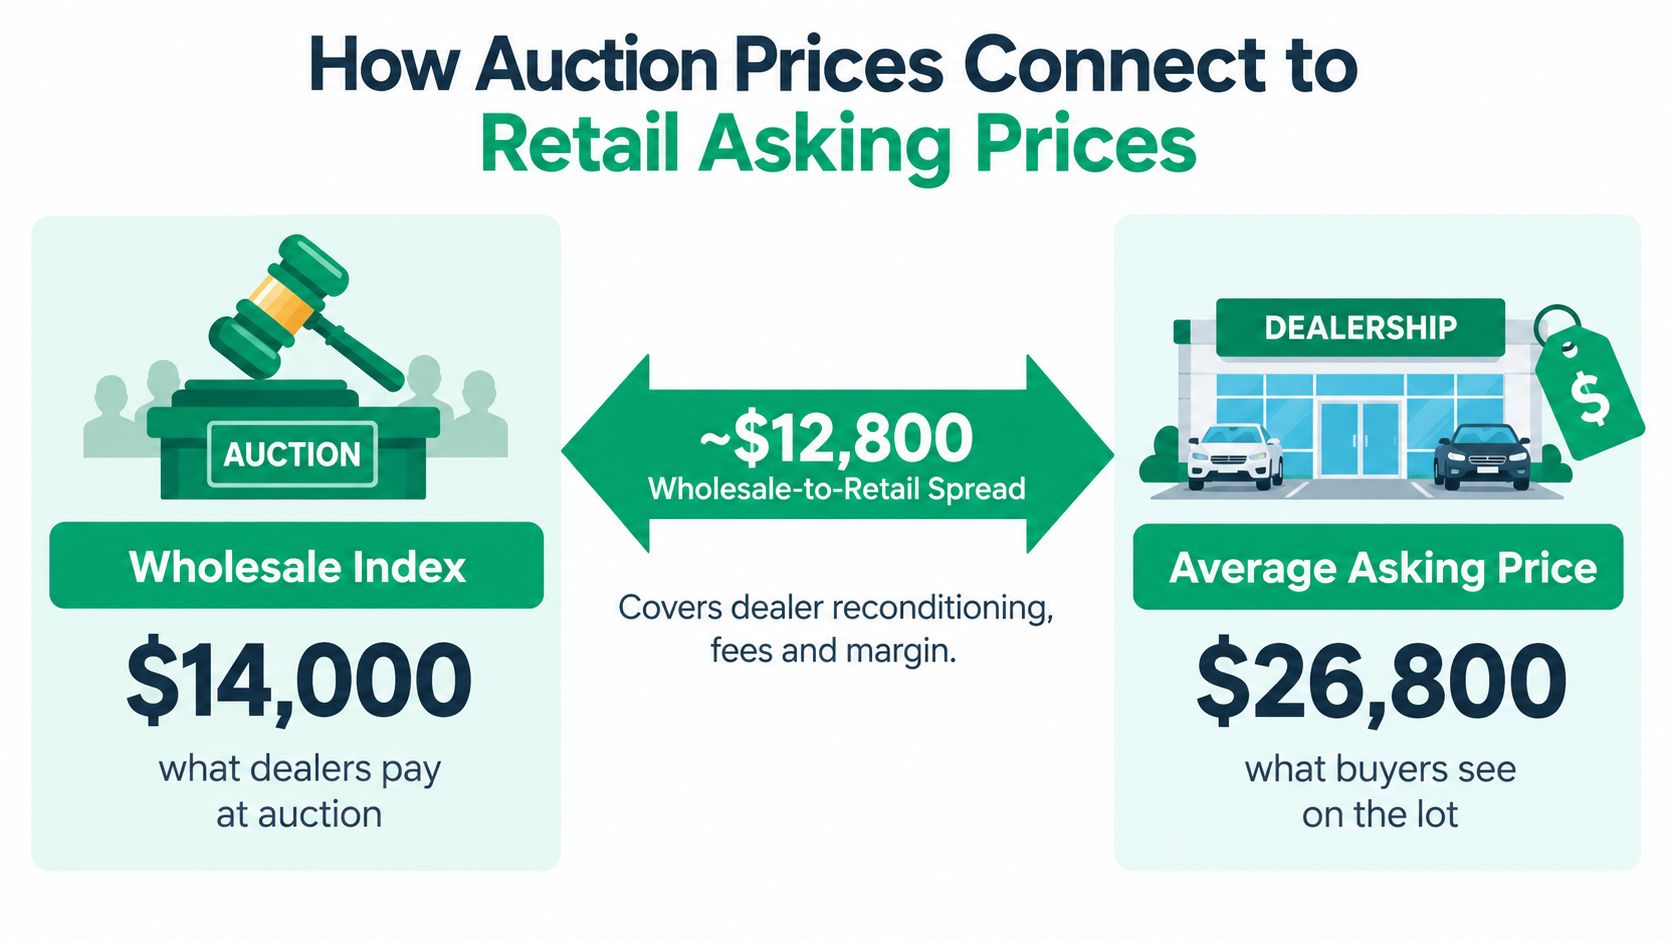
The wholesale figure and the retail listing measure different stages of the transaction. An auction result reflects a vehicle's clearing price in a trade-oriented market. A retail asking price reflects a unit after selection, transportation, inspection, reconditioning, merchandising, financing costs, overhead, and the dealer's target margin. The difference is a spread to underwrite, not an automatic profit pool.
The spread is a business calculation
Earlier 2025 reporting placed the Manheim auction average at about $18,937, while retail prices stayed above prior-year levels for much of that year. The comparison shows why an index cannot answer the bidder's practical question: “What can I pay for this vehicle?” The number that matters is the amount left after all costs and the realistic resale price for that specific unit.
A favorable hammer price can lose its advantage through transport, tires, paint work, diagnostic labor, title processing, or a delayed sale. A Camry vehicle value reference can provide model-specific context, but it should be tested against auction comps and the lot's actual condition.
Small index changes can matter less than one vehicle-level expense. A 2% change on a $14,000 wholesale reference equals $280, an amount that one detail, transport bill, or minor mechanical correction could consume. The arithmetic follows the July market comparison cited above. Market direction helps frame the decision, but deal-level underwriting determines whether the bid works.
Why retail prices don't immediately follow wholesale
Retail asking prices tend to adjust slowly because dealers do not reprice every unit after each auction result. They may protect a pricing floor, wait for existing inventory to sell, or accept a narrower margin rather than advertise a sharp reduction. Wholesale auctions discover a vehicle's clearing price during a short competitive event, so their signals can move first.
The spread also varies by vehicle and buyer pool. It may narrow for highly sought-after inventory and widen for older or harder-to-sell vehicles. A bidder should test condition, region, title status, and expected days to sale before applying any spread. The target is retail outcome minus every cost between the lane and the customer, not the retail asking price itself.
Researching Historical Auction and Salvage Records
The best bid file combines market evidence with vehicle evidence. Start with comparable sales, then verify that the lot you're considering belongs in that comparison group.
Public information from auction operators can reveal the broad structure of recent sales, while dealer-oriented market reports and lane data may expose more relevant comparisons by model, trim, mileage, and condition. The closer the comparable is to the target lot, the more useful it becomes. A same-trim vehicle sold recently in the same region deserves more weight than a national average for the entire model line.
Build the record in layers
Begin with recent sales for the same model year and configuration. Record the sale date, mileage, title status, condition notes, region, and whether the vehicle was retail-ready or repair-dependent. Then examine salvage marketplaces such as Copart and IAA, where photographs, damage descriptions, lot notes, and sale outcomes can show whether the vehicle's paper value matches its physical reality.
History verification should happen before the price decision, not after the win. VIN-level records can reveal title brands, prior damage, theft indicators, liens, odometer inconsistencies, recalls, and earlier auction activity. NMVTIS-related checks are particularly relevant when a branded title or interstate history could change registration and resale prospects.
For teams building repeatable research workflows, this guide to web scraping projects offers useful background on collecting and organizing public web data. Any automated process still needs human review because auction descriptions, images, and title records can conflict.
Evidence hierarchy: A recent, same-region sale of the same trim usually deserves more weight than a broad national index. A verified title problem can outweigh an attractive average price.
Use a VIN report to test the assumptions behind your comp set. A Camry VIN check can help organize vehicle-specific questions, but no report substitutes for inspecting damage, confirming documentation, and calculating repairs.
| Source | What It Shows | Decision Weight | Access |
|---|---|---|---|
| Recent same-trim auction sales | Actual clearing prices and sale context | Highest | Auction data, dealer tools, market records |
| Auction photos and condition notes | Visible damage, missing parts, and disclosure quality | High | Auction listing |
| VIN and title records | Brands, mileage events, theft, liens, and prior history | High | VIN history service and official records |
| Salvage sale history | Prior damage, sale outcomes, and rebuild context | High for damaged units | Salvage auction records |
| Broad wholesale indexes | Market direction and category context | Medium | Public index publications |
| Retail listings | Asking-price environment | Medium, not a transaction guarantee | Dealer websites and marketplaces |
The final check is title-status adjusted. A clean-title comparable shouldn't anchor a bid for a branded-title vehicle, even when the model, year, and mileage look similar. The record should answer three questions: what did comparable vehicles clear for, what condition were they in, and what liabilities will follow this specific VIN?
Bidding Strategies for Salvage, Trade-In, and Dealer Auctions
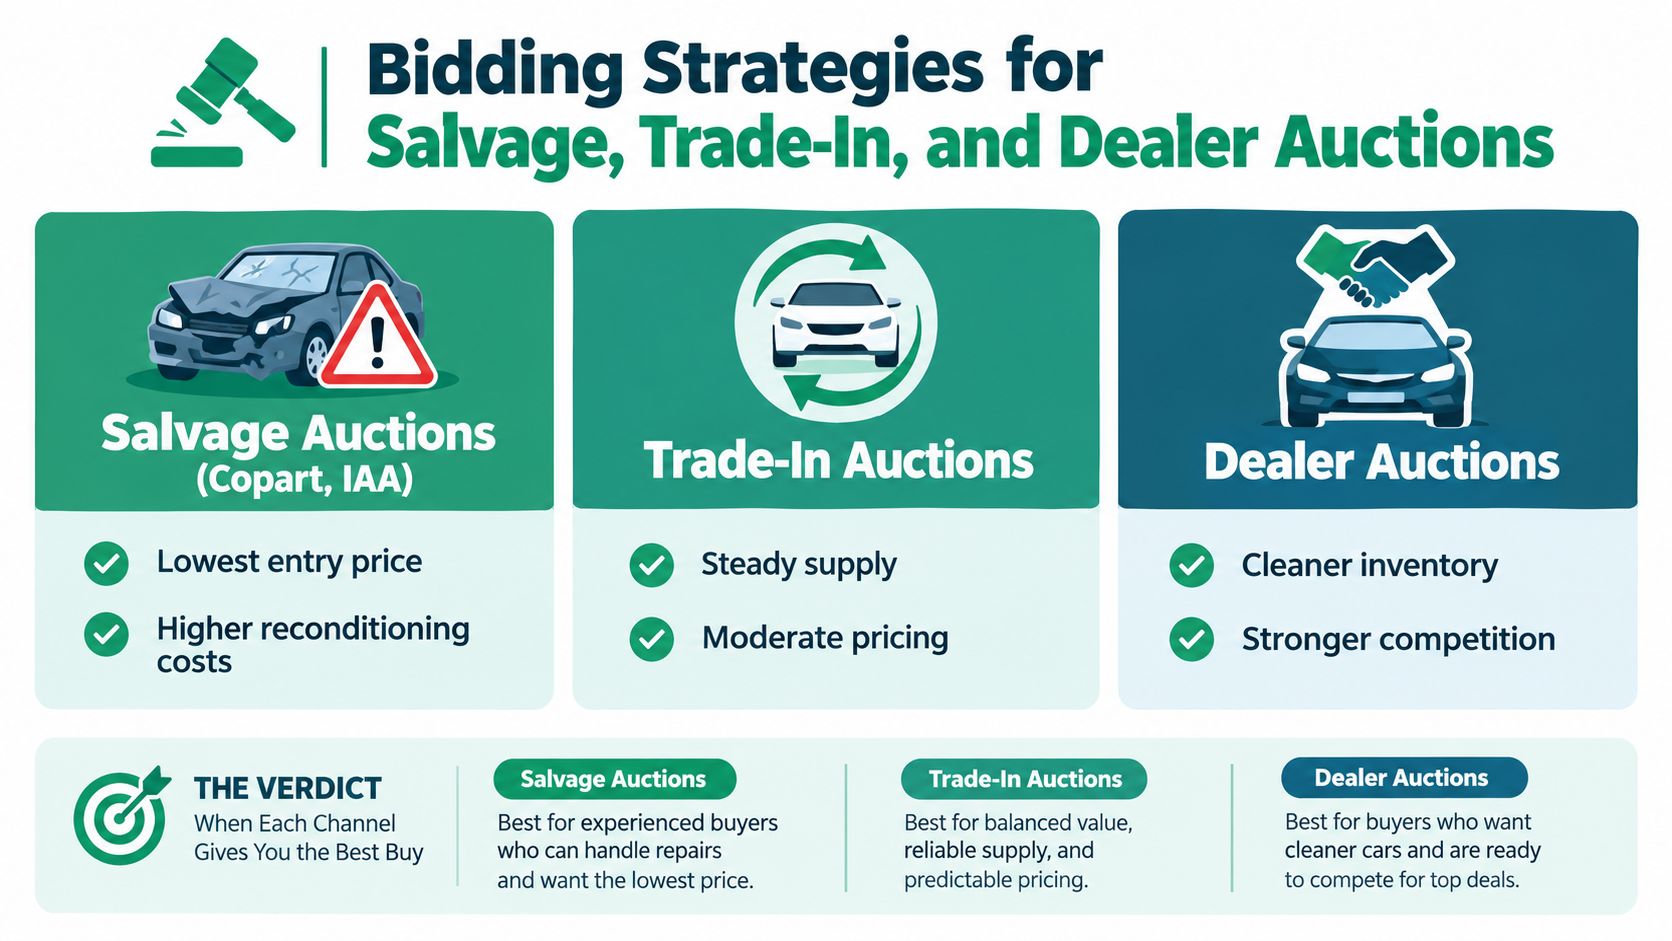
The cheapest hammer price doesn't automatically produce the best buy. Each auction channel transfers a different kind of risk to the bidder, so the right choice depends on your repair capability, inventory needs, resale audience, and tolerance for uncertainty.
Salvage auctions suit repair capacity
Copart and IAA can offer low entry prices because damaged vehicles carry repair, title, transport, and resale risk. That structure suits volume rebuilders, dismantlers, and operators with dependable parts and labor access. It doesn't suit a bidder who treats the hammer price as the purchase price.
A salvage buyer must estimate structural work, airbags, sensors, paint, mechanical damage, storage, inspection, and the resale effect of a branded title. The winning bid is only the first input. An attractive lot can become a poor purchase when uncertain damage forces a large reserve or extends the holding period.
Trade-in inventory favors predictable turnover
Trade-in channels can work better for franchise dealers and independent operators seeking steady, recognizable inventory. These vehicles may offer a clearer path to retail preparation, but competition can be stronger when several buyers understand the same local demand.
The advantage is operational rather than dramatic. A vehicle that needs limited preparation and can enter the retail process quickly may outperform a cheaper project that occupies capital while parts, title work, and repairs remain unresolved. Speed matters because the bidder is financing time as well as metal.
Dealer auctions offer stronger price discovery
Dealer-only marketplaces such as Manheim and ADESA attract a concentrated professional buyer pool. That often makes comparisons more reliable, especially for late-model, high-demand vehicles with transparent condition reports. It can also make bargains harder to find because experienced bidders recognize the same desirable configurations.
| Channel | Better fit | Main advantage | Main risk |
|---|---|---|---|
| Salvage | Rebuilders and dismantlers | Low entry point and repairable volume | Uncertain repairs and branded-title resale |
| Trade-in | Franchise and independent dealers | Turnkey potential and steady sourcing | Narrower margins under active bidding |
| Dealer-only | Operators seeking clean inventory | Strong comps and efficient price discovery | Competition can eliminate the spread |
The best channel changes with the buyer. A rebuilder may create value where a retail-focused dealer sees liability. A dealer with strong local demand may accept a tighter acquisition margin for a clean, fast-moving unit. A new bidder should avoid copying another buyer's ceiling without copying that buyer's repair network, title strategy, and exit market.
A Practical Workflow for Bid Day
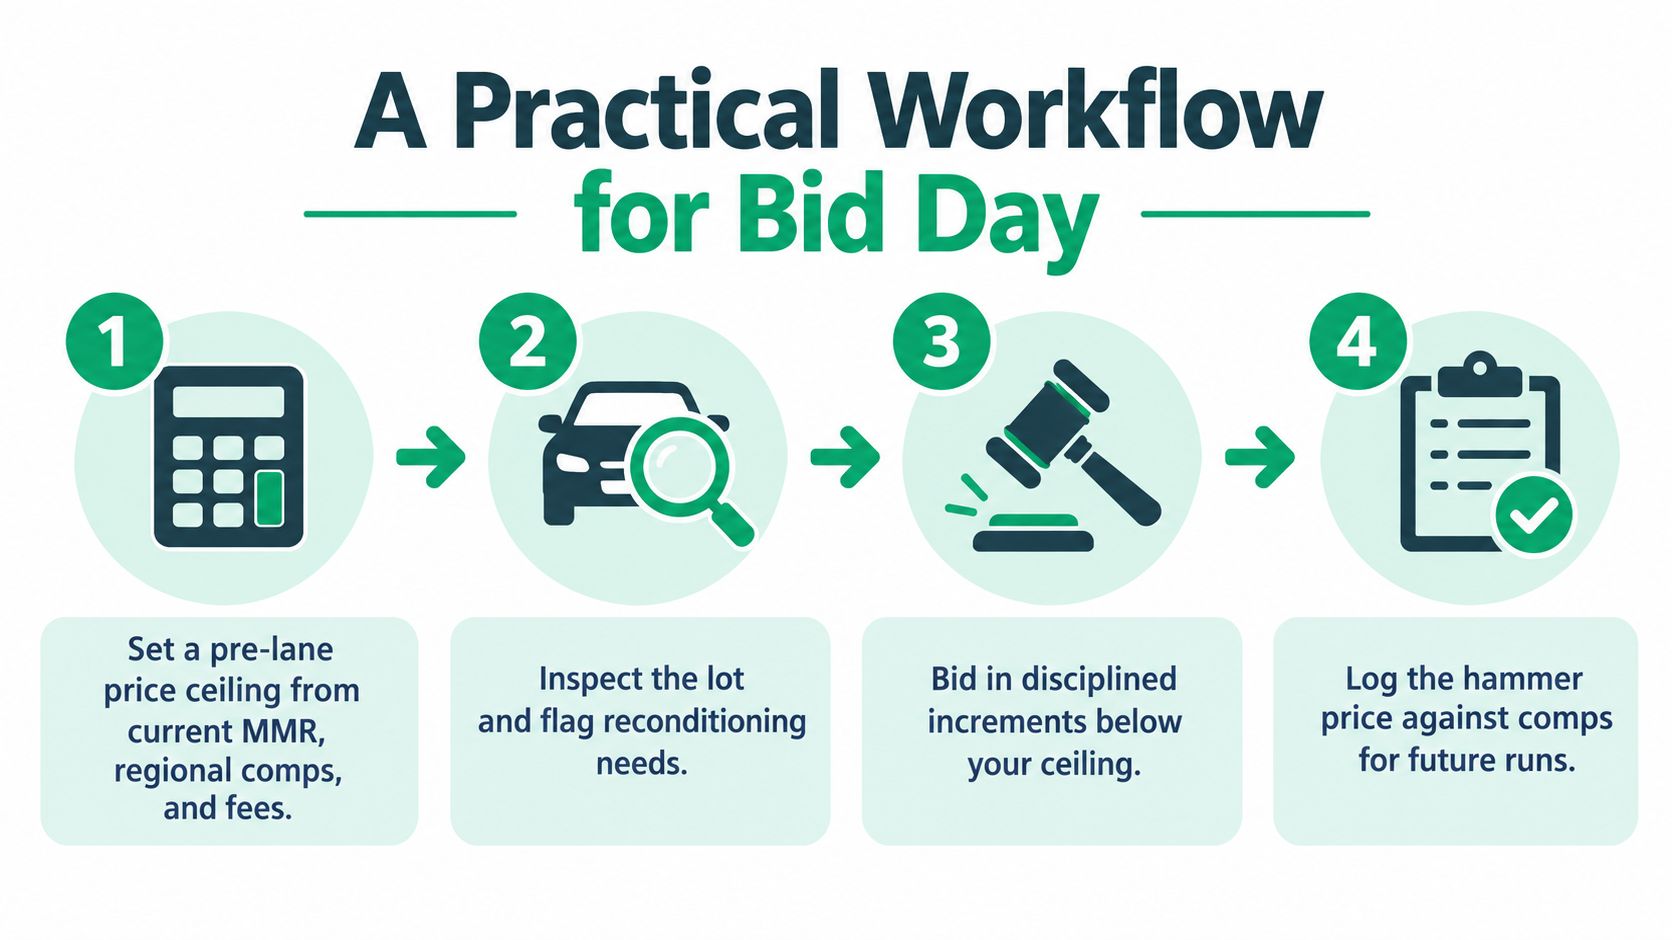
A disciplined bid begins before the auctioneer or online timer creates urgency. Your ceiling should come from evidence collected in advance, then adjusted for the specific lot.
Set the ceiling before the lane
Start with recent comparable sales, current market references, and the vehicle's likely retail outcome. Subtract auction fees, transport, expected reconditioning, title expenses, holding costs, and the margin required for your business model. Treat the result as a maximum hammer price, not a target you need to reach.
The most important discipline is to include uncertainty. If the inspection is limited or the damage description is incomplete, the reserve should rise. If the title is branded, your resale assumption should reflect the actual audience willing to buy it.
Inspect the lot as a risk assessment
Review the photos, condition report, keys, warning lights, panel gaps, tires, glass, underbody, fluids, and signs of water intrusion. For a salvage vehicle, separate visible damage from unknown damage. For a trade-in, look for the small defects that can erase a narrow spread.
A vehicle history report can organize the questions you need to ask about the VIN. VinCheck provides VIN decoding, vehicle history reporting, auction records, value references, mileage checks, title information, and recall data through its vehicle research service.
Bid below the ceiling, then log the outcome
Bid in controlled increments and stop when the total economics fail. Don't increase the ceiling because another bidder is active. The other bidder may know something you don't, or may just be making the same mistake at a higher price.
After the sale, record the final hammer price, fees, transport estimate, repair assumptions, and comparable vehicles. If you passed, log the result anyway. Over time, those records reveal whether your ceilings are too generous, too conservative, or poorly adjusted for specific channels.
The workflow is portable across salvage, trade-in, and dealer-only auctions:
- Price: Establish a maximum hammer price from comps and complete costs.
- Verify: Match the VIN, title, mileage, condition, and equipment to the comp set.
- Inspect: Convert visible and uncertain defects into explicit deductions.
- Bid: Stop below the ceiling when the deal no longer supports your margin.
- Review: Compare the result with your estimate and refine the next bid.
Use a model-specific reference such as the Toyota vehicle research page only as one input. The final ceiling must still reflect the individual lot and its exit market.
Where Auction Prices Are Heading and What It Means for You
Wholesale declines do not automatically produce cheaper retail vehicles. In July 2026, auction values cooled while retail listings stayed near record levels, leaving dealers room to protect the spread instead of passing the full change to shoppers. For a bidder, that gap matters more than a headline index because fees, transport, repairs, and resale timing determine the lot's actual economics.
The useful question is not whether the overall index rises or falls. It is which vehicle types, powertrains, title categories, and regions are separating from the average.
Powertrain is becoming a pricing fault line
A September 2026 industry summary reported used EV auction prices up 2.3% year over year, while non-EV prices fell 1.3%, according to The Auto Wire's used-vehicle value summary. An aggregate index can therefore conceal either the opportunity or the risk in the category you are bidding on.
The same source reported broader Manheim index growth of 2.0% year over year in September 2025, 1.7% in August 2025, and around 2.1% in June 2026. Those readings establish market context, but they cannot show whether a particular EV, gas-powered truck, or late-model off-lease vehicle is fairly priced. Recent category-level and regional comps provide a more useful ceiling.
Watch supply, credit, and timing
Lease maturities, EV residual resets, and cross-border tariff exposure may change inventory mix and acquisition costs during the remainder of 2026. These are risks, not certain outcomes. Watch actual lane behavior rather than assuming a broad market narrative applies to every auction.
Credit tightening could reduce retail purchasing power and weaken demand for higher-priced inventory. Hurricane season could create local supply shocks where damaged vehicles, replacement demand, and transport capacity meet. Published indexes also lag completed transactions, so the reported reading may trail conditions in an active lane.
The edge is not forecasting the index. It's buying a vehicle whose repair and resale economics remain sound when the index is wrong for your category.
Accurate reconditioning estimates can create room to buy while retail prices remain firm. A bidder who assumes retail prices will fall at the wholesale rate may overpay, either because dealers hold asking prices or because the lot's segment is moving differently from the aggregate market.
Use the benchmark to frame conditions. Use VIN records, recent regional comps, powertrain-specific evidence, and a complete cost ceiling to set the bid. That approach turns auto auction car prices into a defensible decision rather than a reaction to a market headline.
VinCheck helps auction buyers verify VIN details, title brands, mileage issues, salvage events, recalls, prior auction activity, and vehicle value context before bidding. Review the vehicle's history and pricing signals together before committing capital to the next lot.
About the author
VinCheck Editorial Team — Editorial Standards & Review
The VinCheck Editorial Team reviews every published article against NMVTIS data accuracy and NHTSA recall validity. This byline appears on collaborative pieces and quick-update posts.